Quantific Tactical Indicator Performance
Quantific Tactical Indicator Performance
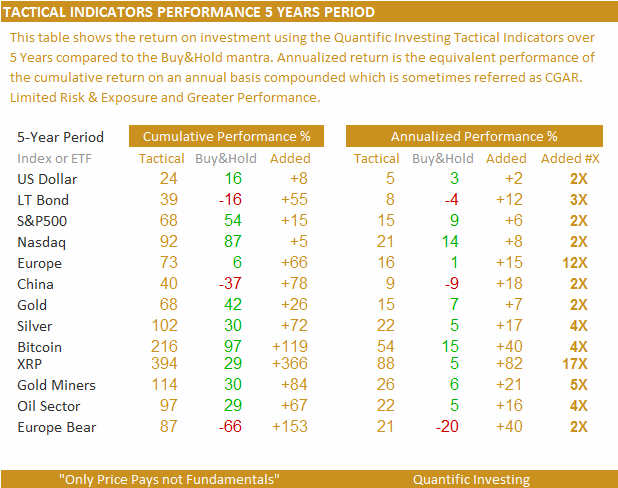
Limited Risk & Exposure and Greater Performance

This is what happen to Buy & Hold investors in 2022:

Markets are so unstable lately with the 0Day Options trading creating all kind of false signals and fake swings. Fortunately the Quantific Tactical indicators worked as expected and disregard the noise.
This table shows the performance of the Quantific Investing Tactical Allocation Indicators over a 5 Years period.
The Tactical Allocation Indicators are provided in the Quantific Investing Report under this section including the indicators Performance over 5 Years.

The Tactical Allocation Indicators turned bullish the week of January 6 and the topping indicator turned on the week of February 10. So in just 4 week you could have made 10% with a 2X Long SP500 ETF with limited exposure an risk. You get in, you get out and you wait while the correction that followed happens. It’s that simple. No guess work, no need to read tons of articles and burn your brain’s out.

Here’s an example of the Tactical Allocation Section in the Quantific Investing Report as of December 2022.

The Tactical column gave the Buy signal and the Rev column indicated the topping signal to take profit or close the position. And for the enthusiastic investors the price performance is also indicated with price highlight to indicator significant changes. And the cherry on the cake is the Tactical Allocation Indicator back testing performance over the past 5 Years shows the Performance compared to the Buy & Hold investor. Most investing letter show only their best performing trades or a line chart over time. It’s easy to make a line chart look good as you only need a few months or years of better performance to outperform the index.
The Tactical Allocation indicator for the SP500 returned +15% annualized compared to the SP500 Buy & Hold which did +7%. It’s twice the performance of the Buy & Hold without the risk or the exposure! And it’s an annualized return not a just a cumulative one. So this means the overall performance is the equivalent of 15% per year! The annualized return represents the equivalent of the cumulative on an annual basis.
With the Tactical Allocation section you can get in when it rises and get out when it falls.
This first section of the report which includes comments and analysis brief.

The report also provide specific Trade opportunities or trend changes that you can profit from. The report is available in a PDF format so can download and print to read later.
Report has 3 sections:
Relative Performance: Overall brief with relative performance chart, indicators and personal comments and review
Tactical Allocation: Asset classes performance with technical indicators and up-to-date Tactical Model performance results
Opportunities: Good Risk/Reward investments Swing Trades ideas with charts. This Trades can be short, medium or long term depending on the markets moves.
And unlike most publications I do not write to fill the pages with text and overload clients with pointless narrative. I keep it Brief and right to the point so you can see what’s going on, assess the situation, make a plan and take action.
Don’t let the Hedge Funds bully your Savings.
Empower yourself and subscribe now!